

A new Jewish Studies course on statistics and data visualization is attracting students from a range of disciplines, helping to fulfill their breadth requirementsand introducing some math-shy undergrads to the idea that numbers aren’t so scary after all.
Designed and taught by political science PhD candidate Alexis Lerner, the course is called Jews: By the Numbers and it offers an accessible introduction to applied statistics and data science at the Anne Tanenbaum Centre for Jewish Studies in the Faculty of Arts & Science. The innovative course – one of the first of its kind – is supported by the Joseph Lebovic Fund in Jewish Studies.
But what does it mean to work with data and statistics in a Jewish studies course? For Lerner, it means not only teaching her students to work with materials like survey results, codebooks, archives and data visualization, but also to understand the larger context of data.
“When we’re looking at an illustration or some kind of data output,” says Lerner, “we’re always trying to look at the same things: What is being communicated here as opposed to what the scholar or writer claims is being communicated? Are those things in conflict or do they work together? I try to reinforce how we can criticize data production and data illustration.”
Telling stories, one dataset at a time
Lerner wants to make her students understand not only data itself but also the stories it tells. Where does data come from? Who amasses and distributes it, and for what purpose? How can data be used to tell stories – or lies?
In her class, she uses existing datasets and archives like the PEW Research Center’s “Portrait of Jewish Americans” (2013), the Anti-Defamation League’s Global 100 Index on anti-Semitism(2015), the Armed Conflict Location and Event Data Project (2018) and the International Tracing Service’s Digital Collection Archive (2015).
Lerner is intimately familiar with these datasets not only from her time as a graduate student, but also her past work teaching seventh graders about the Holocaust in her hometown of Detroit, her time as a Sills-Glass National Leadership Fellow at the Anti-Defamation League, as well as a weeklong seminar she attended at the US Holocaust Memorial Museum.
“I’ve completely created this course from scratch. I workshopped the syllabus for quite a long time,” she says, even making changes to the course content after learning three of her 13 students were majoring in geography.
“I brought in a selection of readings about the geography of the Holocaust and the use of quantitative platforms to analyze space. I wanted to give the geography students something that might be useful and interesting to them. And they loved it.”
Levi Cassidy, a fourth-year student majoring in Russian language and literature, found Lerner’s class eye-opening. While data may not always reveal something entirely new, it offers “a new way of looking at old things,” he says. “This is where its value lies: data can clarify a situation or a set of facts, but only relative to some other variable. It can tell us about new aspects of things that were already there.”
Accuracy and accessibility: coding Holocaust survivors’ testimonies
“Ultimately, in all my work, I try to take big data and boil it down to its most basic measurements and then communicate it in a way that is accessible while being statistically accurate,” says Lerner, whose dissertation examines political dissent in authoritarian regimes, particularly in the post-Soviet region.
Her students implemented this commitment to accuracy and accessibility in their final projects analyzing Holocaust survivors’ video testimonies from the USC Shoah Foundation’s Visual History Archive.
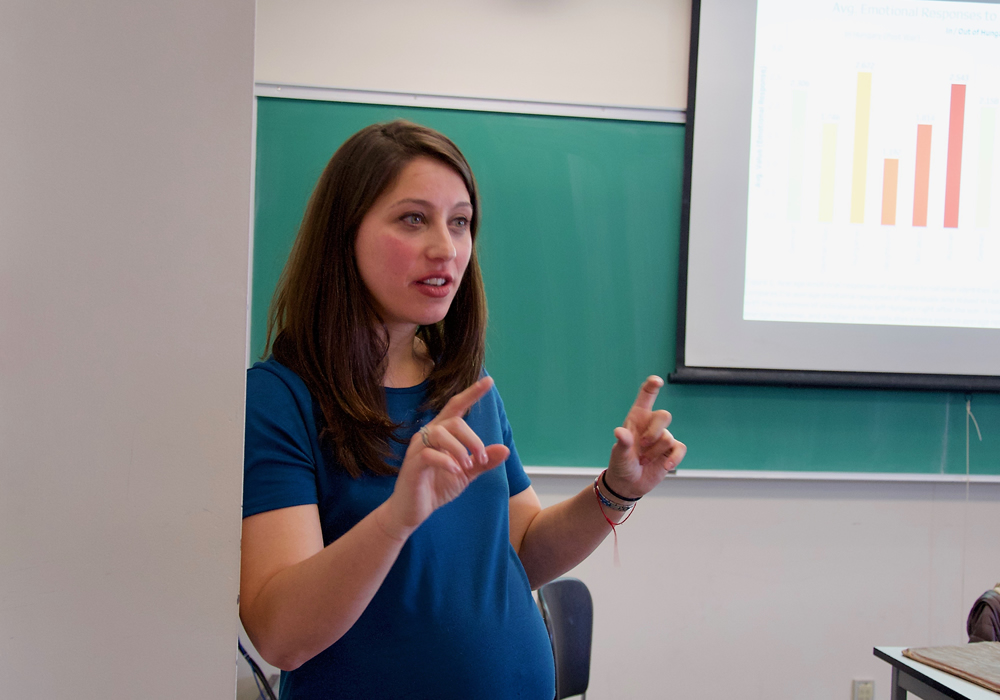
They watched videos of survivors telling their stories, and then coded the emotional responses exhibited by the survivors on a numeric scale of one to five, where three was neutral. Then, they plotted these responses against other variables, such as a survivor’s age or their use of certain words and phrases, revealing unexpected connections between emotions and circumstances.
Lerner’s students are adamant that the quantification and measurement they performed on survivor testimonies did not depersonalize the stories they examined, a stereotype often used to criticize quantitative research methods.
“Once you learn the methods that go into statistical analysis, you understand how it’s not reductionist,” says Daria Mancino, a third-year student completing a double major in urban studies and the peace, conflict and justice program. “That’s really the overarching importance of this course for the social sciences or humanities: to show us why quantifying something isn’t necessarily reductionist.”
Martina Facchin, a second-year student completing a double major in political science and the peace, conflict and justice program, agrees. “If anything, the process of coding emotional responses made me feel more connected to the survivor’s testimonies. It made me realize just how unique every survivor story is – and the risk of generalizing them.”
Lerner hopes her students will leave her class with a critical eye for data and what goes into making it. Should survey questions be weighted, for example? How large of a sample size is large enough for results to be reliable? How do we know that survey respondents aren’t lying? How should we calculate margins of error?
Lerner’s students will leave the course with the tools to be critical analysts, meticulous researchers and – perhaps most importantly – thoughtful citizens in an information-heavy world.